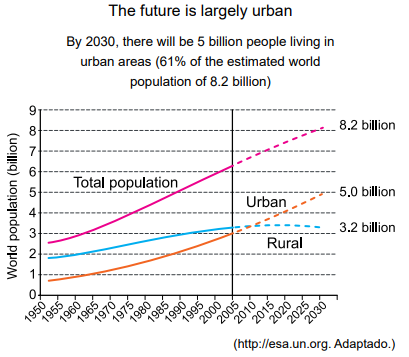
The chart shows that the approximate period of time when both urban and rural estimated populations were equal was
O gráfico mostra que o período aproximado de tempo em que a estimativa de populações urbana e rural era igual
e. um pouco depois de 2005 e por volta de 2010.