A figura a seguir exibe o gráfico de uma função y = f(x) para 0 ≤ x ≤ 3.
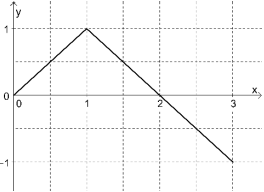
O gráfico de y = [f(x)]2 é dado por

  • a

  • b

  • c

  • d

A partir do gráfico do enunciado, tem-se:

«math style=¨font-family:Tahoma¨ xmlns=¨http://www.w3.org/1998/Math/MathML¨»«mstyle mathsize=¨14px¨»«mrow»«mi mathvariant=¨normal¨»f«/mi»«mo»(«/mo»«mi mathvariant=¨normal¨»x«/mi»«mo»)«/mo»«mo»§#xA0;«/mo»«mo»=«/mo»«mo»§#xA0;«/mo»«mfenced open=¨{¨ close=¨¨»«mtable columnspacing=¨1.4ex¨ columnalign=¨right center¨»«mtr»«mtd»«mi mathvariant=¨normal¨»x«/mi»«mo»,«/mo»«/mtd»«mtd»«mi»se«/mi»«mo»§#xA0;«/mo»«mn»0«/mn»«mo»§#xA0;«/mo»«mo»§#x2A7D;«/mo»«mo»§#xA0;«/mo»«mi mathvariant=¨normal¨»x«/mi»«mo»§#xA0;«/mo»«mo»§#x2A7D;«/mo»«mo»§#xA0;«/mo»«mn»1«/mn»«/mtd»«/mtr»«mtr»«mtd»«mo»§#x2013;«/mo»«mi mathvariant=¨normal¨»x«/mi»«mo»+«/mo»«mn»2«/mn»«mo»,«/mo»«/mtd»«mtd»«mi»se«/mi»«mo»§#xA0;«/mo»«mn»1«/mn»«mo»§#xA0;«/mo»«mo»§#x2A7D;«/mo»«mo»§#xA0;«/mo»«mi mathvariant=¨normal¨»x«/mi»«mo»§#xA0;«/mo»«mo»§#x2A7D;«/mo»«mo»§#xA0;«/mo»«mn»3«/mn»«/mtd»«/mtr»«/mtable»«/mfenced»«/mrow»«/mstyle»«/math»

Denotando [f(x)]2 por g(x), tem-se:

«math style=¨font-family:Tahoma¨ xmlns=¨http://www.w3.org/1998/Math/MathML¨»«mstyle mathsize=¨14px¨»«mrow»«mi mathvariant=¨normal¨»g«/mi»«mo»(«/mo»«mi mathvariant=¨normal¨»x«/mi»«mo»)«/mo»«mo»§#xA0;«/mo»«mo»=«/mo»«mo»§#xA0;«/mo»«mfenced open=¨{¨ close=¨¨»«mtable columnspacing=¨1.4ex¨ columnalign=¨right left¨»«mtr»«mtd»«msup»«mi mathvariant=¨normal¨»x«/mi»«mn»2«/mn»«/msup»«mo»,«/mo»«/mtd»«mtd»«mi»se«/mi»«mo»§#xA0;«/mo»«mn»0«/mn»«mo»§#xA0;«/mo»«mo»§#x2A7D;«/mo»«mo»§#xA0;«/mo»«mi mathvariant=¨normal¨»x«/mi»«mo»§#xA0;«/mo»«mo»§#x2A7D;«/mo»«mo»§#xA0;«/mo»«mn»1«/mn»«mo»,«/mo»«mo»§#xA0;«/mo»«mi»ou«/mi»«mo»§#xA0;«/mo»«mi»seja«/mi»«mo»,«/mo»«/mtd»«/mtr»«mtr»«mtd»«mo»(«/mo»«mo»§#x2013;«/mo»«mi mathvariant=¨normal¨»x«/mi»«mo»+«/mo»«mn»2«/mn»«msup»«mo»)«/mo»«mn»2«/mn»«/msup»«mo»,«/mo»«/mtd»«mtd»«mi»se«/mi»«mo»§#xA0;«/mo»«mn»1«/mn»«mo»§#xA0;«/mo»«mo»§#x2A7D;«/mo»«mo»§#xA0;«/mo»«mi mathvariant=¨normal¨»x«/mi»«mo»§#xA0;«/mo»«mo»§#x2A7D;«/mo»«mo»§#xA0;«/mo»«mn»3«/mn»«/mtd»«/mtr»«/mtable»«/mfenced»«mspace linebreak=¨newline¨/»«mspace linebreak=¨newline¨/»«mi mathvariant=¨normal¨»g«/mi»«mo»(«/mo»«mi mathvariant=¨normal¨»x«/mi»«mo»)«/mo»«mo»§#xA0;«/mo»«mo»=«/mo»«mo»§#xA0;«/mo»«mfenced open=¨{¨ close=¨¨»«mtable columnspacing=¨1.4ex¨ columnalign=¨right center¨»«mtr»«mtd»«msup»«mi mathvariant=¨normal¨»x«/mi»«mn»2«/mn»«/msup»«mo»,«/mo»«/mtd»«mtd»«mi»se«/mi»«mo»§#xA0;«/mo»«mn»0«/mn»«mo»§#xA0;«/mo»«mo»§#x2A7D;«/mo»«mo»§#xA0;«/mo»«mi mathvariant=¨normal¨»x«/mi»«mo»§#xA0;«/mo»«mo»§#x2A7D;«/mo»«mo»§#xA0;«/mo»«mn»1«/mn»«/mtd»«/mtr»«mtr»«mtd»«msup»«mi mathvariant=¨normal¨»x«/mi»«mn»2«/mn»«/msup»«mo»§#x2013;«/mo»«mn»4«/mn»«mi mathvariant=¨normal¨»x«/mi»«mo»+«/mo»«mn»4«/mn»«mo»,«/mo»«/mtd»«mtd»«mi»se«/mi»«mo»§#xA0;«/mo»«mn»1«/mn»«mo»§#x2A7D;«/mo»«mo»§#xA0;«/mo»«mi mathvariant=¨normal¨»x«/mi»«mo»§#xA0;«/mo»«mo»§#x2A7D;«/mo»«mo»§#xA0;«/mo»«mn»3«/mn»«/mtd»«/mtr»«/mtable»«/mfenced»«mtable»«mtr/»«/mtable»«/mrow»«/mstyle»«/math»

A alternativa que melhor representa o gráfico de g(x) é C.