A - Represente graficamente no plano cartesiano a função: «math xmlns=¨http://www.w3.org/1998/Math/MathML¨»«mstyle mathsize=¨14px¨»«mrow»«mi mathvariant=¨normal¨»P«/mi»«mo»(«/mo»«mi mathvariant=¨normal¨»t«/mi»«mo»)«/mo»«mo»=«/mo»«mfenced open=¨{¨ close=¨¨»«mtable columnalign=¨left¨»«mtr»«mtd»«msup»«mi mathvariant=¨normal¨»t«/mi»«mn»2«/mn»«/msup»«mo»-«/mo»«mn»4«/mn»«mi mathvariant=¨normal¨»t«/mi»«mo»+«/mo»«mn»10«/mn»«mo»§#xA0;«/mo»«mi»se«/mi»«mo»§#xA0;«/mo»«mi mathvariant=¨normal¨»t«/mi»«mo»§#x2264;«/mo»«mn»4«/mn»«/mtd»«/mtr»«mtr»«mtd»«mn»12«/mn»«mo»-«/mo»«mi mathvariant=¨normal¨»t«/mi»«mo»§#xA0;«/mo»«mi»se«/mi»«mo»§#xA0;«/mo»«mi mathvariant=¨normal¨»t«/mi»«mo»§gt;«/mo»«mn»4«/mn»«/mtd»«/mtr»«/mtable»«/mfenced»«/mrow»«/mstyle»«/math»

Se a função P(t ) , em centenas de reais, expressa o preço de um produto depois de estar t anos no mercado (0 ≤ t ≤ 8), qual foi o preço máximo alcançado pelo produto?


B - Qual foi o menor preço alcançado pelo produto nesse período de 8 anos?

A)

Para construir o gráfico de uma função definida por mais de uma sentença, analisa-se cada sentença separadamente.
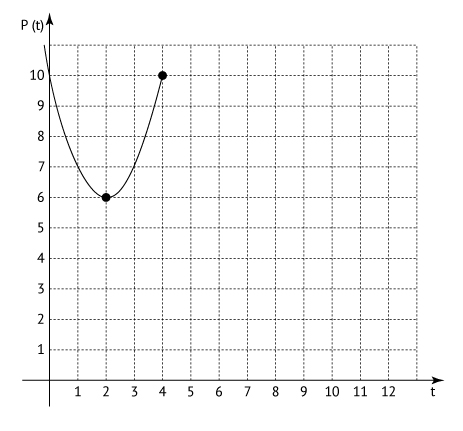
I) O gráfico da função «math style=¨font-family:Tahoma¨ xmlns=¨http://www.w3.org/1998/Math/MathML¨»«mstyle mathsize=¨14px¨»«mrow»«mi mathvariant=¨normal¨»P«/mi»«mo»(«/mo»«mi mathvariant=¨normal¨»t«/mi»«mo»)«/mo»«mo»§#xA0;«/mo»«mo»=«/mo»«mo»§#xA0;«/mo»«msup»«mi mathvariant=¨normal¨»t«/mi»«mn»2«/mn»«/msup»«mo»§#xA0;«/mo»«mo»-«/mo»«mo»§#xA0;«/mo»«mn»4«/mn»«mi mathvariant=¨normal¨»t«/mi»«mo»§#xA0;«/mo»«mo»+«/mo»«mo»§#xA0;«/mo»«mn»10«/mn»«/mrow»«/mstyle»«/math», para «math style=¨font-family:Tahoma¨ xmlns=¨http://www.w3.org/1998/Math/MathML¨»«mstyle mathsize=¨14px¨»«mi mathvariant=¨normal¨»t«/mi»«mo»§#xA0;«/mo»«mo»§#x2264;«/mo»«mo»§#xA0;«/mo»«mn»4«/mn»«/mstyle»«/math», é o arco de parábola representado a seguir:
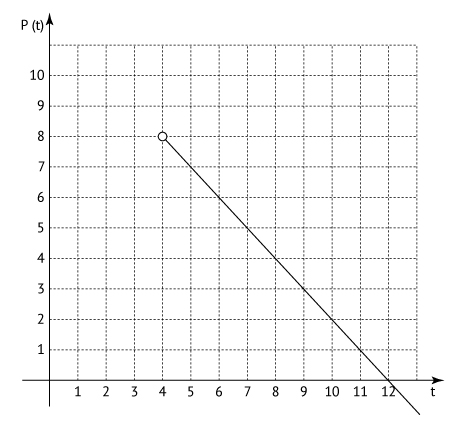
II) O gráfico da função «math style=¨font-family:Tahoma¨ xmlns=¨http://www.w3.org/1998/Math/MathML¨»«mstyle mathsize=¨14px¨»«mrow»«mi mathvariant=¨normal¨»P«/mi»«mo»(«/mo»«mi mathvariant=¨normal¨»t«/mi»«mo»)«/mo»«mo»§#xA0;«/mo»«mo»=«/mo»«mo»§#xA0;«/mo»«mn»12«/mn»«mo»§#xA0;«/mo»«mo»-«/mo»«mo»§#xA0;«/mo»«mi mathvariant=¨normal¨»t«/mi»«/mrow»«/mstyle»«/math», para «math style=¨font-family:Tahoma¨ xmlns=¨http://www.w3.org/1998/Math/MathML¨»«mstyle mathsize=¨14px¨»«mrow»«mi mathvariant=¨normal¨»t«/mi»«mo»§#xA0;«/mo»«mo»§gt;«/mo»«mo»§#xA0;«/mo»«mn»4«/mn»«/mrow»«/mstyle»«/math», é a semirreta representada a seguir:

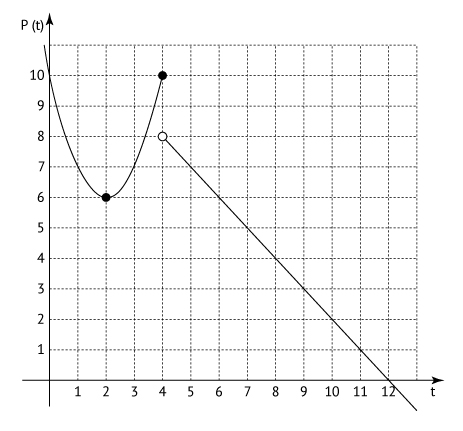
A reunião dos gráficos obtidos em (I) e (II) é o gráfico da função P(t):

Restringindo-se o gráfico ao intervalo «math style=¨font-family:Tahoma¨ xmlns=¨http://www.w3.org/1998/Math/MathML¨»«mstyle mathsize=¨14px¨»«mrow»«mn»0«/mn»«mo»§#xA0;«/mo»«mo»§#x2264;«/mo»«mo»§#xA0;«/mo»«mi mathvariant=¨normal¨»t«/mi»«mo»§#xA0;«/mo»«mo»§#x2264;«/mo»«mo»§#xA0;«/mo»«mn»8«/mn»«/mrow»«/mstyle»«/math», tem-se:

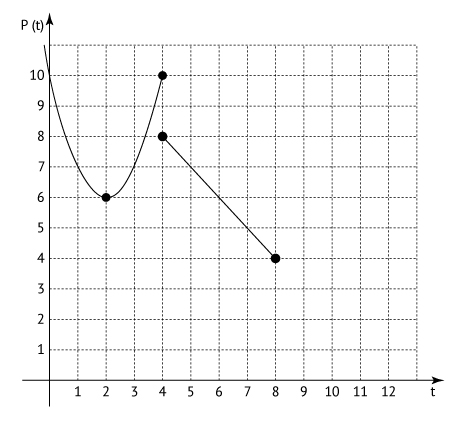
Dessa representação gráfica, pode-se observar que o preço máximo alcançado pelo produto no intervalo «math style=¨font-family:Tahoma¨ xmlns=¨http://www.w3.org/1998/Math/MathML¨»«mstyle mathsize=¨14px¨»«mrow»«mn»0«/mn»«mo»§#xA0;«/mo»«mo»§#x2264;«/mo»«mo»§#xA0;«/mo»«mi mathvariant=¨normal¨»t«/mi»«mo»§#xA0;«/mo»«mo»§#x2264;«/mo»«mo»§#xA0;«/mo»«mn»8«/mn»«/mrow»«/mstyle»«/math» é de 10 centenas de reais, ou seja, R$ 1000,00.

Resposta:


e R$ 1000,00.


B)

Do item anterior, pela representação gráfica tem-se que o menor preço alcançado pelo produto no intervalo 0 ≤ t ≤ 8 é de 4 centenas de reais, ou seja, R$ 400,00.

Resposta: R$ 400,00.