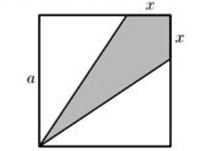
Considere o quadrado de lado a > 0 exibido na figura abaixo. Seja A(x) a função que associa a cada 0  x a a área da região indicada pela cor cinza.
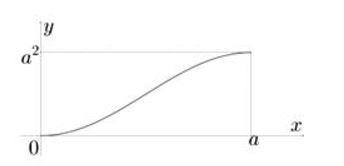
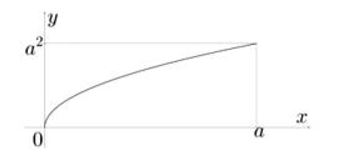
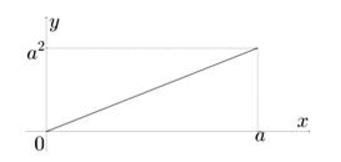
O gráfico da função y = A(x) no plano cartesiano é dado por
- a
- b
- c
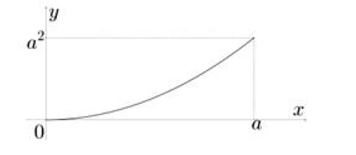
- d
A partir da figura dada, tem-se
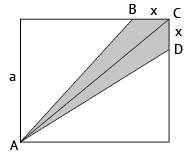
Como os triângulos ABC e ADC são congruentes, então suas áreas são iguais.
Da figura, tem-se que o triângulo ABC tem base e altura com medidas iguais a x e a, respectivamente. Então:

Como  , a função A(x) tem como gráfico um segmento de reta, o que está representado na alternativa D.